I’ve always been interested in developer experience and understanding the metrics often used to measure this unique type of productivity. It’s extremely enticing to think that If I could change my tooling, gain insight through telemetry and other metrics, I could potentially “game” a better and more fullfilling developer experience overall - and ultimately over-achieve when typically I would just coast through. The experience I’m talking about improving is not so much solely about the 9-5 day job work, but more about the overarching craft of engineering. Whether you’re coding away on pet projects on nights and weekends, tinkering with editors or Linux distros, or learning new technologies and programming languages for work, the underlying takeaways and insights one could gain from these developer experience metrics would carry over to all tangible coding activities that we do.
A while back, I watched one of Adam Tornhill’s talks on YouTube and the idea of “Your Code as a Crime Scene”. This was around the time that I started dabbling with Clojure and when I found out he wrote a book of the same title that followed a tool he released online, written in Clojure - it was a perfect match of interests and technology for me. Cloning the repo and following the README, code-maat https://github.com/adamtornhill/code-maat was relatively easy to get up and running for baseline code analysis. The basic gist of this all is that you install the repo and run some jars over a git log that you save locally for static analysis. The GitHub page is well-documented but perhaps I will share my own notes (in the Notes section) for how I got it up and running at least.
I decided to run this against a personal (what feels like a lifelong or lifetime) endeavor, my emacs config, and was curious to see what the output was. What follows was some insights, however obvious some may be, but also insightful findings from the code-maat output.
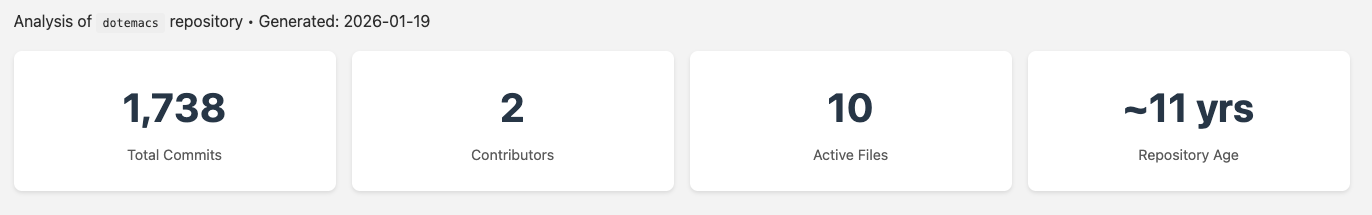
Top-level numbers on my dotemacs https://github.com/jonathanchu/dotemacs repo. Over 11 years and 1,738 commits of config changes, visual UI and modeline tweaking, and transitions to org mode literate source blocks back to plain old elisp (and maybe a few more cycles of that dance over the years) ;)
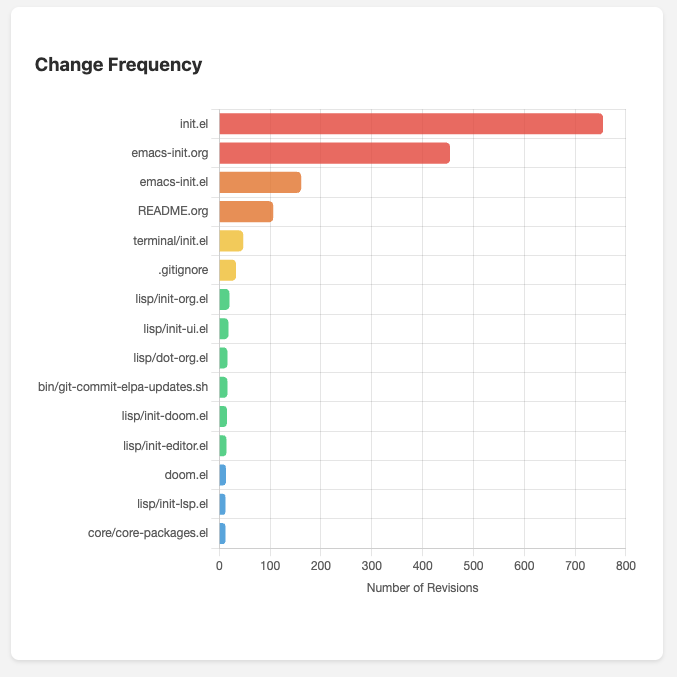
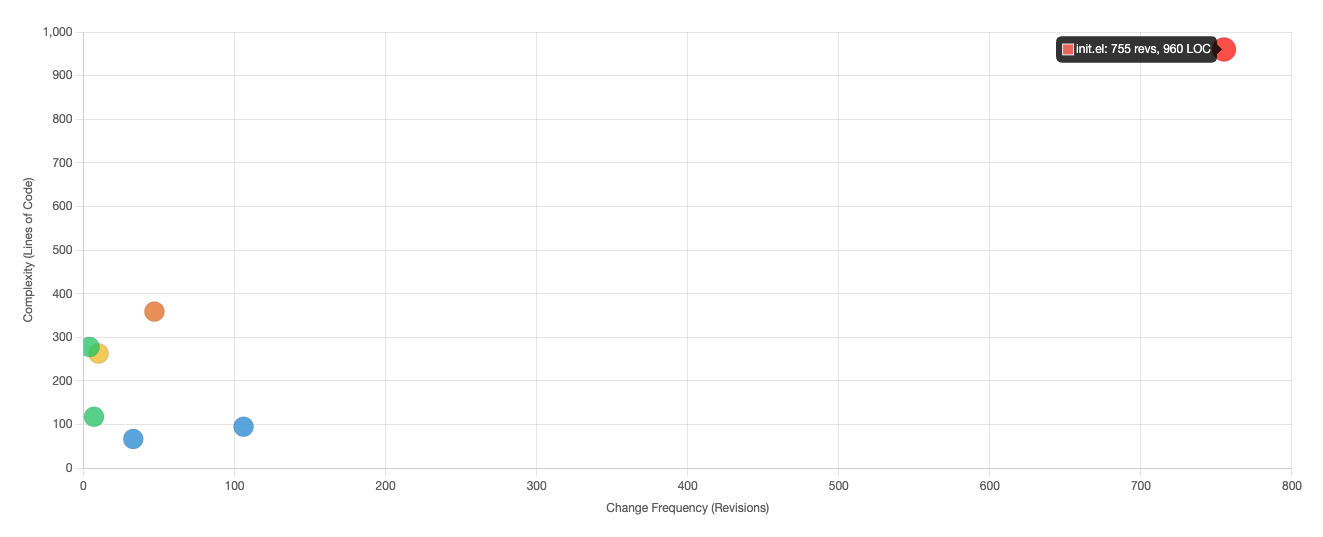
Hotspots (Most Changed Files)
This highlights files with the highest change frequency. These are potential hostpost where bugs tend to cluster and where refactoring may have the highest impact. Since these are screenshots, the large red dot in the first quadrant is my init.el file.
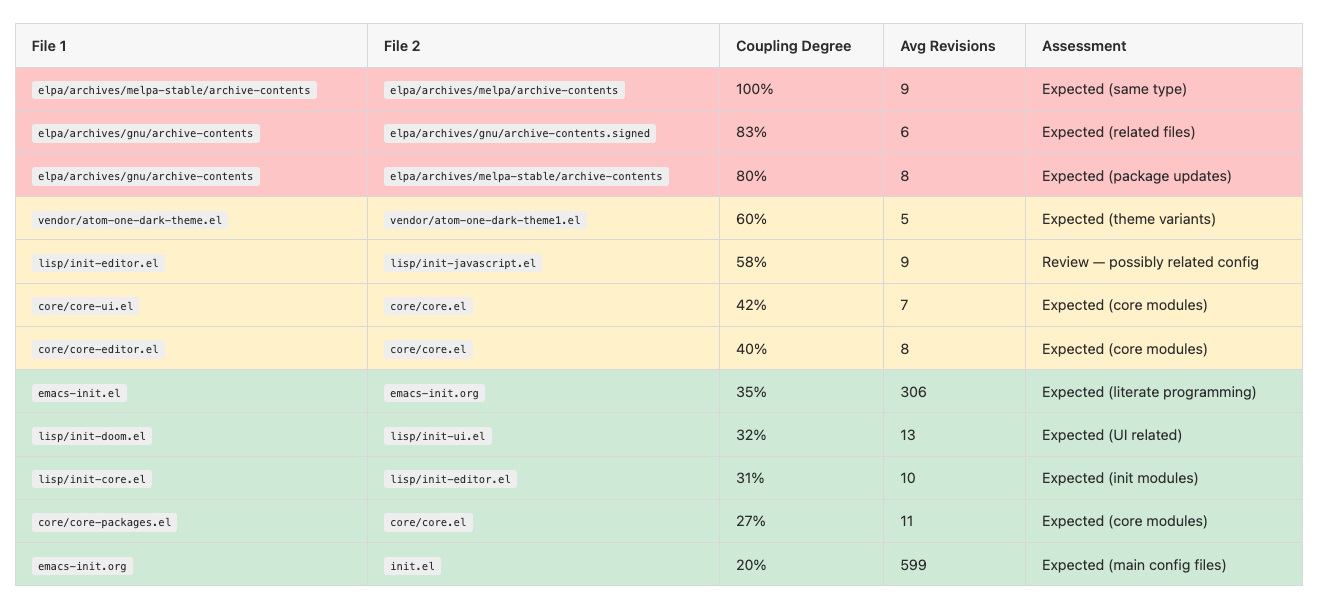
Temporal Coupling is an interesting relationship insight into files and pairs of files.
What this shows is files that frequently change together in the same commits. High coupling (60%+) between unrelated files may indicate hidden dependencies. Low coupling between related files (like .el and .org) is expected and healthy. There were no surprises here other than being impressed at how well this worked on first analysis. For example, when my emacs-init.org changed, so did my emacs-init.el in an expected and coupled manner.
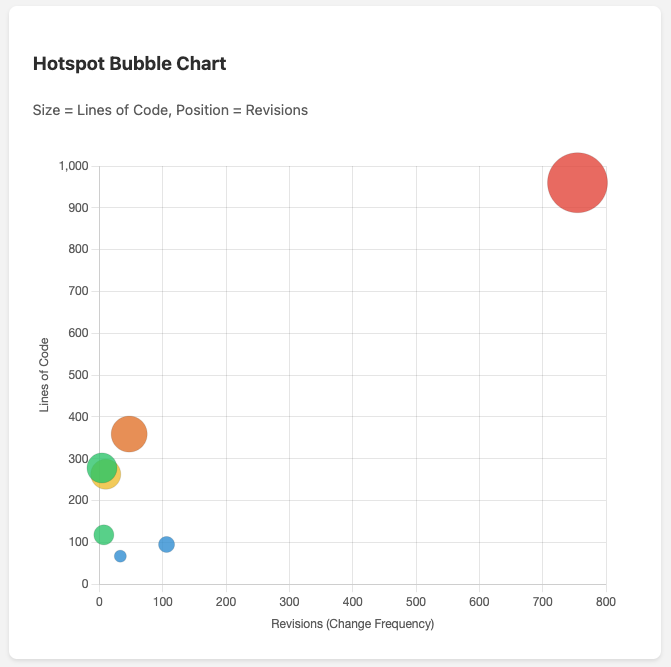
Code Complexity vs Change Frequency
I think this was the most interesting and valuable metric and visualization. This is the “hotspot” visualization from the book and files in the upper-right quadrant (large file AND frequently changed) are the highest priority for refactoring.
I took it a step further and put an overlay over the hotspot chart to better show the risk and complexity.
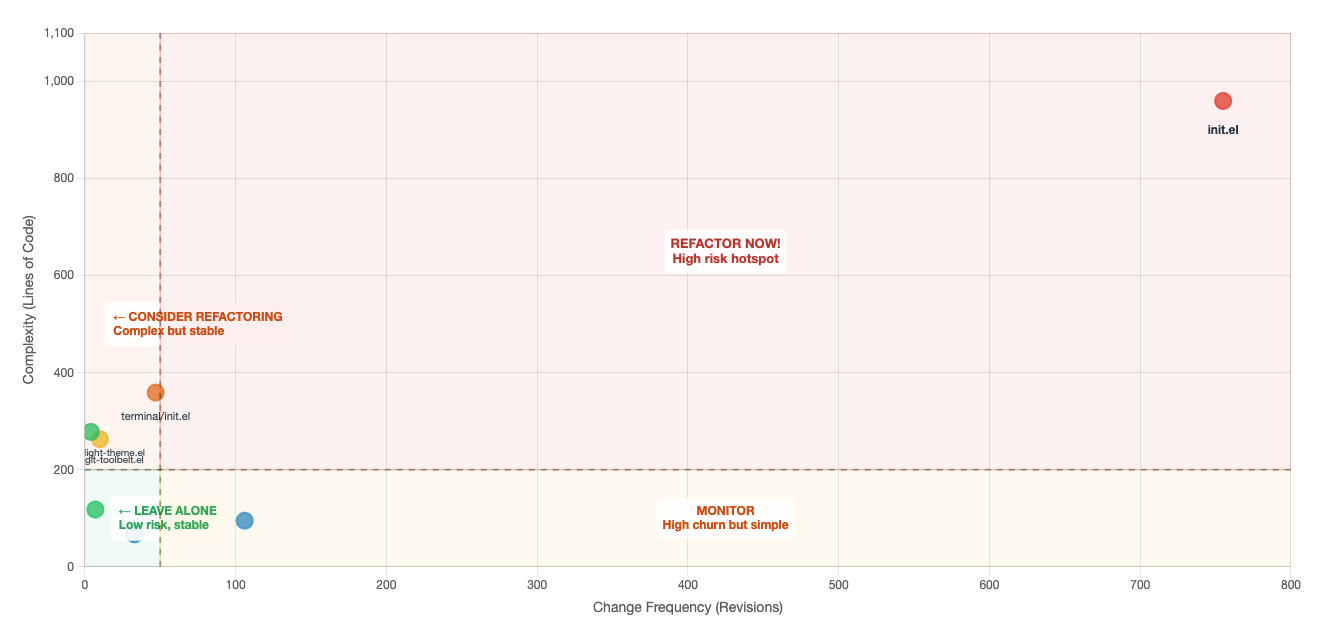
This chart shows the files plotted by complexity (LOC in this case) vs change frequency, with quadrants indicating refactoring priority.
- Top-Right (Red): High complexity + High churn = Refactor now — these are your biggest risks
- Top-Left (Orange): High complexity + Low churn = Consider refactoring — complex but stable
- Bottom-Right (Yellow): Low complexity + High churn = Monitor — lots of changes but manageable
- Bottom-Left (Green): Low complexity + Low churn = Leave alone — no action needed
All in all, this was a really neat and interesting tool to play around with, despite it being on a somewhat trivial, but active, repository. I am thinking of how I can leverage this in my day-to-day in a more automated way. In the meantime, if you want to try this out for yourself (go see code-maat) or just want to get your toes wet with static code analysis, I extracted the essential git commands for you to replicate this to a smaller degree. Give it a shot and see what insights you can gain!
Git Commands Reference
Hotspots - Most frequently changed files
git log --format=format: --name-only | grep -v '^$' | sort | uniq -c | sort -rn | head -20
Code Churn - Total lines added/removed per file
git log --numstat --format= | awk '{add[$3]+=$1; del[$3]+=$2} END {for(f in add) if(f) printf "%d\t%d\t%d\t%s\n", add[f]+del[f], add[f], del[f], f}' | sort -rn | head -20
Code Age - Last modification date per file
git ls-files | while read f; do echo "$(git log -1 --format='%ai' -- "$f") $f"; done | sort -r
Temporal Coupling - Files that change together
git log --format='%H' | head -200 | while read commit; do
  files=$(git diff-tree --no-commit-id --name-only -r $commit | sort)
  echo "$files" | while read f1; do
    echo "$files" | while read f2; do
      if [[ "$f1" < "$f2" ]]; then echo "$f1 <-> $f2"; fi
    done
  done
done | sort | uniq -c | sort -rn | head -20
Commit Frequency - Commits per day
git log --format='%as' | sort | uniq -c
Lines of Code - Current state
git ls-files '*.el' | xargs wc -l | sort -rn